Posted in Stocks

Aboitiz Power Technical Analysis

I’ve been holding this stock since Aug 25 as i saw it in BPITrade reco with an upside of 24%.

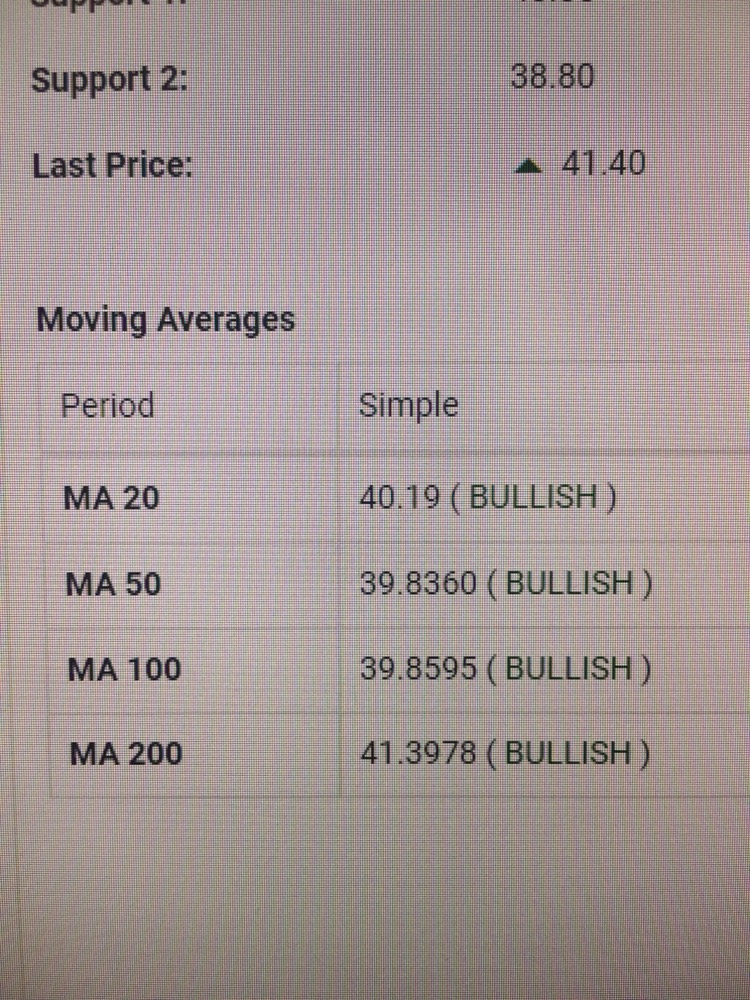
TP is set at 51.02 which is much higher than the 52 WkHi of 46.80

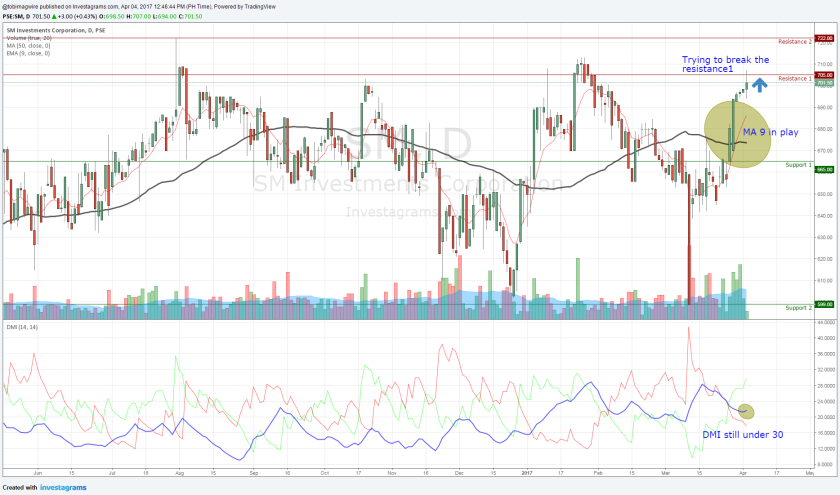
As of today the stock is bullish, all Moving Average is up

It hits MA200 earlier but didnt hold, a good sign that it may try to hit tomorrow

RSI is not yet over bought a good sign that it still has some room for buyers to come in.

As usual TAYOR.

Posted in Stocks

JFC Technical Analysis

Today i tried using Know Sure Thing as indicator to analyze if we have a buy/sell signal or confirmation of trends for JFC

KST is developed by Martin Pring, it shows overall momentum of a stock.

As you can see from the image the KST cross the signal line which means a buy signal, lets just hope it stays above until it reaches the zero line to confirm an uptrend.

Update: As of last day JFC is trying to break the first Resistance at 199.9, although Net Foreign is dumping their shares.

MA20 is now on Bullish side, the next MA is still way far but lets hope it reach soon

Moving Averages
Period Simple Exponential
MA 20 193.1950 ( BULLISH ) 194.4706 ( BULLISH )
MA 50 199.7440 ( BEARISH ) 198.8381 ( BEARISH )
MA 100 204.2620 ( BEARISH ) 206.4522 ( BEARISH )
MA 200 225.45 ( BEARISH ) 214.6432 ( BEARISH )

Caveat: tayor

Posted in Stocks

SM Technical Analysis

SM-04042017

This is my personal view on $SM

Analyzing the chart above we can see that the Moving Average is perfectly in play and we don’t see any sign of slowing down.

DMI although below 30 but still pointing upward so it may hit that point. I use DMI to check if its time to Enter a stock, the green line should be above the red line and the blue line should be above 30.

Other indicators are all Bullish, except for VolumneSMA(15)

Here’s investagrams table of Moving Average and Indicators

Moving Averages
Period Simple Exponential
MA 20 662.20 ( BULLISH ) 672.1229 ( BULLISH )
MA 50 673.85 ( BULLISH ) 669.1411 ( BULLISH )
MA 100 663.9250 ( BULLISH ) 667.6400 ( BULLISH )
MA 200 668.8333 ( BULLISH ) 659.7077 ( BULLISH )
Indicators
Name Value Action
RSI(14) 62.0702 BULLISH
MACD(12,26,9) 7.3923, 1.2673002770 BULLISH
ATR(14) 14.3550 (2.06%) LOW
CCI(20) 170.5351 BULLISH
STS(14,3,3) 98.8402 NEUTRAL
Williams %R(14) 0.00 NEUTRAL
VolumeSMA(15) 554,107 BEARISH
CandleStick(1) White Marubozu BULLISH

Caveat: trade at your own risk

Posted in Stocks

MWC

Practise chart observation. Correct me if im wrong.

Setup ko is Stochastic, here yung red line di pa umaangat but its good na nasa baba sya

RSI wala pa sa 30 para maging oversold pero data shows na foreign is buying now.

It is near the immediate support of 29.90 so pwede mag test buy dito

Note: wala ako nito, just practising charts 🙂